对图算法有兴趣的朋友可以关注微信公众号 :《 Medical与AI的故事》
预测链接:三角形和聚类系数
推荐方案通常是基于某种形式的三角形度量进行预测,因此让我们看看它们是否对我们的示例有进一步的帮助。我们可以通过执行以下查询来计算节点所属的三角形数及其聚类系数:
CALL algo.triangleCount('Author', 'CO_AUTHOR_EARLY', { write:true,
writeProperty:'trianglesTrain', clusteringCoefficientProperty:
'coefficientTrain'});
CALL algo.triangleCount('Author', 'CO_AUTHOR', { write:true,
writeProperty:'trianglesTest', clusteringCoefficientProperty:
'coefficientTest'});
以下函数将向我们的DataFrame添加这些功能:
def apply_triangles_features(data, triangles_prop, coefficient_prop):
    query = """
    UNWIND $pairs AS pair
    MATCH (p1) WHERE id(p1) = pair.node1
    MATCH (p2) WHERE id(p2) = pair.node2
    RETURN pair.node1 AS node1,
            pair.node2 AS node2,
            apoc.coll.min([p1[$trianglesProp], p2[$trianglesProp]])
                                                    AS minTriangles,
            apoc.coll.max([p1[$trianglesProp], p2[$trianglesProp]])
                                                    AS maxTriangles,
            apoc.coll.min([p1[$coefficientProp], p2[$coefficientProp]])
                                                    AS minCoefficient,
            apoc.coll.max([p1[$coefficientProp], p2[$coefficientProp]])
                                                    AS maxCoefficient
    """
    params = {
            "pairs": [{"node1": row["node1"], "node2": row["node2"]}
                                for row in data.collect()],
            "trianglesProp": triangles_prop,
            "coefficientProp": coefficient_prop
    }
    features = spark.createDataFrame(graph.run(query, params).to_data_frame())
    return data.join(features, ["node1", "node2”])
 注意,我们已经为三角形计数和聚类系数算法使用了最小和最大前缀。在无向图中,我们需要一种方法来防止我们的模型根据两个作者被传入的次序进行学习。为了做到这一点,我们已经用最小计数和最大计数将这些特征分割开来。
我们可以使用以下代码将此功能应用于我们的训练和测试DataFrame:
training_data = apply_triangles_features(training_data,
                                        "trianglesTrain", "coefficientTrain")
test_data = apply_triangles_features(test_data,
                                    "trianglesTest", "coefficientTest”)
并运行此代码来显示每个三角形特征的描述性统计信息:
(training_data.filter(training_data["label"]==1)
.describe()
.select("summary", "minTriangles", "maxTriangles",
                    "minCoefficient", "maxCoefficient")
.show())
(training_data.filter(training_data["label"]==0)
.describe()
.select("summary", "minTriangles", "maxTriangles", "minCoefficient",
                                                    "maxCoefficient")
.show())
我们可以在下表中看到运行这些代码的结果。
+---------+--------------------+-------------------+--------------------+--------------------+
| summary | minTriangles       | maxTriangles      | minCoefficient     | maxCoefficient     |
+---------+--------------------+-------------------+--------------------+--------------------+
| count   | 81096              | 81096             | 81096              | 81096              |
| mean    | 19.478260333431983 | 27.73590559337082 | 0.5703773654487051 | 0.8453786164620439 |
| stddev  | 65.7615282768483   | 74.01896188921927 | 0.3614610553659958 | 0.2939681857356519 |
| min     | 0                  | 0                 | 0.0                | 0.0                |
| max     | 622                | 785               | 1.0                | 1.0                |
+---------+--------------------+-------------------+--------------------+--------------------+


+---------+-------------------+--------------------+---------------------+--------------------+
| summary | minTriangles      | maxTriangles       | minCoefficient      | maxCoefficient     |
+---------+-------------------+--------------------+---------------------+--------------------+
| count   | 81096             | 81096              | 81096               | 81096              |
| mean    | 5.754661142349808 | 35.651980368945445 | 0.49048921333297446 | 0.860283935358397  |
| stddev  | 20.639236521699   | 85.82843448272624  | 0.3684138346533951  | 0.2578219623967906 |
| min     | 0                 | 0                  | 0.0                 | 0.0                |
| max     | 617               | 785                | 1.0                 | 1.0                |
+---------+-------------------+--------------------+---------------------+--------------------+
注意,在这个比较中,coauthorship和no-coauthorship数据之间没有太大的区别。这可能意味着这些特征并不是具有预测性的。 我们可以通过运行以下代码来训练其他模型:
fields = ["commonAuthors", "prefAttachment", "totalNeighbors",
        "minTriangles", "maxTriangles", "minCoefficient", "maxCoefficient"]
triangle_model = train_model(fields, training_data)
现在让我们评估模型并显示结果:
triangle_results = evaluate_model(triangle_model, test_data)
display_results(triangle_results)
triangles模型的预测指标如下表所示:
+-----------+----------+
| measure   | score    |
+-----------+----------+
| accuracy  | 0.992924 |
| recall    | 0.965384 |
| precision | 0.958582 |
+-----------+----------+
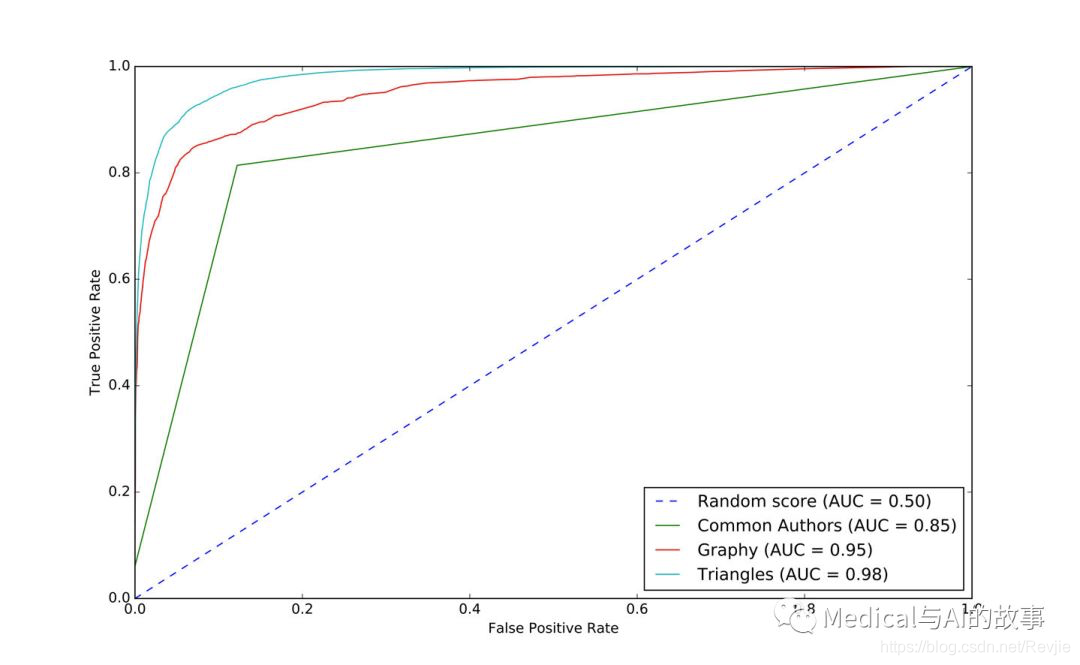
通过将每个新特征添加到以前的模型中,我们的预测措施得到了很好的提高。我们将三角形模型添加到ROC曲线图中,代码如下:
plt, fig = create_roc_plot()
add_curve(plt, "Common Authors",
            basic_results["fpr"], basic_results["tpr"], basic_results["roc_auc"])
add_curve(plt, "Graphy",
            graphy_results["fpr"], graphy_results["tpr"],
                                    graphy_results["roc_auc"])
add_curve(plt, "Triangles",
            triangle_results["fpr"], triangle_results["tpr"],
                                    triangle_results["roc_auc"])
plt.legend(loc='lower right')
plt.show()
我们可以在图8-13中看到输出。
 图8-13.triangles模型的ROC曲线
我们的模型已经得到了普遍的改进,并且我们在预测措施方面处于90%+的预测能力。提高通常是很困难的,因为最易获得的成果已经拿到了,但仍有改进的空间。让我们看看重要的特征是如何改变的:
rf_model = triangle_model.stages[-1]
plot_feature_importance(fields, rf_model.featureImportances)
运行该函数的结果如图8-14所示。
 图8-14.特征的重要性:三角形(triangles)模型
common authors特征仍然对我们的模型有最大的单一影响。也许我们需要看看新的领域,看看当我们添加社区信息时会发生什么。
预测链接:社区检测
我们假设在同一个社区中的节点如果还没有连接的话,它们之间更有可能有联系。此外,我们相信社区越紧密,联系越可能。
首先,我们将使用Neo4j中的LPA来计算更粗粒度的社区。我们通过运行以下查询来实现这一点,该查询将社区存储在训练集的partitionTrain属性中,以及测试集的partitionTest属性中:
CALL algo.labelPropagation("Author", "CO_AUTHOR_EARLY", "BOTH",
{partitionProperty: "partitionTrain"});
CALL algo.labelPropagation("Author", "CO_AUTHOR", "BOTH",
{partitionProperty: "partitionTest"});
我们还将使用Louvain算法计算更细粒度的组。Louvain算法返回中间聚类,我们将这些聚类中最小的聚类存储在训练集的louvainTrain属性中,测试集的louvainTest属性中:
CALL algo.louvain.stream("Author", "CO_AUTHOR_EARLY",
                        {includeIntermediateCommunities:true})
YIELD nodeId, community, communities
WITH algo.getNodeById(nodeId) AS node, communities[0] AS smallestCommunity
SET node.louvainTrain = smallestCommunity;
CALL algo.louvain.stream("Author", "CO_AUTHOR",
                        {includeIntermediateCommunities:true})
YIELD nodeId, community, communities
WITH algo.getNodeById(nodeId) AS node, communities[0] AS smallestCommunity
SET node.louvainTest = smallestCommunity;
现在我们将创建以下函数来返回这些算法的值:
def apply_community_features(data, partition_prop, louvain_prop):
    query = """
    UNWIND $pairs AS pair
    MATCH (p1) WHERE id(p1) = pair.node1
    MATCH (p2) WHERE id(p2) = pair.node2
    RETURN pair.node1 AS node1,
            pair.node2 AS node2,
            CASE WHEN p1[$partitionProp] = p2[$partitionProp] THEN
                        1 ELSE 0 END AS samePartition,
            CASE WHEN p1[$louvainProp] = p2[$louvainProp] THEN
                        1 ELSE 0 END AS sameLouvain
    """
    params = {
        "pairs": [{"node1": row["node1"], "node2": row["node2"]} for
                            row in data.collect()],
        "partitionProp": partition_prop,
        "louvainProp": louvain_prop
    }
    features = spark.createDataFrame(graph.run(query, params).to_data_frame())
    return data.join(features, ["node1", "node2"])
我们可以使用以下代码将此功能应用于Spark中的训练和测试DataFrame:
training_data = apply_community_features(training_data,
                                            "partitionTrain", "louvainTrain")
test_data = apply_community_features(test_data, "partitionTest", "louvainTest")
我们可以运行此代码来查看节点对是否属于同一分区:
plt.style.use('fivethirtyeight')
fig, axs = plt.subplots(1, 2, figsize=(18, 7), sharey=True)
charts = [(1, "have collaborated"), (0, "haven't collaborated”)]
for index, chart in enumerate(charts):
    label, title = chart
    filtered = training_data.filter(training_data["label"] == label)
    values = (filtered.withColumn('samePartition',
                F.when(F.col("samePartition") == 0, "False")
            .otherwise("True"))
            .groupby("samePartition")
            .agg(F.count("label").alias("count"))
            .select("samePartition", "count")
            .toPandas())
    values.set_index("samePartition", drop=True, inplace=True)
    values.plot(kind="bar", ax=axs[index], legend=None,
            title=f"Authors who {title} (label={label})")
    axs[index].xaxis.set_label_text("Same Partition”)
plt.tight_layout()
plt.show()
我们可以在图8-15中看到运行该代码的结果。
 图8-15 同一分区
看起来这个特征可以很好地预测那些合作过的作者比那些没有合作过的作者更有可能在同一个分区中。我们可以通过运行以下代码为Louvain聚类做同样的事情:
plt.style.use('fivethirtyeight')
fig, axs = plt.subplots(1, 2, figsize=(18, 7), sharey=True)
charts = [(1, "have collaborated"), (0, "haven't collaborated")]
for index, chart in enumerate(charts):
    label, title = chart
    filtered = training_data.filter(training_data["label"] == label)
    values = (filtered.withColumn('sameLouvain',
                F.when(F.col("sameLouvain") == 0, "False")
                                        .otherwise("True"))
                .groupby("sameLouvain")
                .agg(F.count("label").alias("count"))
                .select("sameLouvain", "count")
                .toPandas())
    values.set_index("sameLouvain", drop=True, inplace=True)
    values.plot(kind="bar", ax=axs[index], legend=None,
                title=f"Authors who {title} (label={label})")
    axs[index].xaxis.set_label_text("Same Louvain")
plt.tight_layout()
plt.show()
我们可以在图8-16中看到运行该代码的结果。
 图8-16。同一个Louvain聚类
看起来这个特征是非常具有预测性的,而且合作过的作者很可能在同一个集群中,而那些没有合作过的作者则不太可能在同一个集群中。 我们可以通过运行以下代码来训练其他模型:
fields = ["commonAuthors", "prefAttachment", "totalNeighbors",
            "minTriangles", "maxTriangles", "minCoefficient", "maxCoefficient",
            "samePartition", "sameLouvain"]
community_model = train_model(fields, training_data)
现在让我们评估模型并显示结果:
community_results = evaluate_model(community_model, test_data)
display_results(community_results)
社区模型(community model)的预测指标如下有:
+-----------+----------+
| measure   | score    |
+-----------+----------+
| accuracy  | 0.995771 |
| recall    | 0.957088 |
| precision | 0.978674 |
+-----------+----------+
我们的一些度量指标已经改进,因此为了进行比较,让我们通过运行以下代码为所有模型绘制ROC曲线:
plt, fig = create_roc_plot()
add_curve(plt, "Common Authors",
            basic_results["fpr"], basic_results["tpr"], basic_results["roc_auc"])
add_curve(plt, "Graphy",
            graphy_results["fpr"], graphy_results["tpr"],
            graphy_results["roc_auc"])
add_curve(plt, "Triangles",
            triangle_results["fpr"], triangle_results["tpr"],
            triangle_results["roc_auc"])
add_curve(plt, "Community",
            community_results["fpr"], community_results["tpr"],
            community_results["roc_auc"])
plt.legend(loc='lower right')
plt.show()
我们可以在图8-17中看到输出。
 图8-17。社区模型的ROC曲线
我们可以通过添加社区模型看到改进,因此让我们看看哪些是最重要的特征:
rf_model = community_model.stages[-1]
plot_feature_importance(fields, rf_model.featureImportances)
运行该函数的结果如图8-18所示。
 图8-18。特征重要性:社区模式
尽管common authors模型总体上非常重要,但最好避免有一个过度占主导地位的元素,它可能会扭曲对新数据的预测。社区检测算法中的所有特征在我们的最后一个模型中有很大的影响,这有助于完善我们的预测方法。
在我们的例子中,我们已经看到简单的基于图的特征是一个很好的开始,然后随着我们添加更多的基于graphy和图算法的特征,我们继续改进我们的预测措施。我们现在有了一个好的、平衡的模型来预测合著关系。
使用图进行关联特征提取可以显著提高我们的预测。理想的图特征和算法取决于数据的属性,包括网络域和图形形状。我们建议首先考虑数据中的预测元素,并在微调之前测试具有不同类型连接特征的假设。
读者练习
有几个领域需要调查,以及调查构建其他模型的方法。以下是一些进一步探索的想法: 我们的会议数据模型对我们没有包括的会议数据的预测性如何? 测试新数据时,删除某些功能会发生什么? 训练和测试的年数划分是否会影响我们的预测? 此数据集在论文之间也有引文;我们可以使用该数据生成不同的特征或预测未来引文吗?
总结
在本章中,我们研究了使用图形特征和算法来增强机器学习。我们介绍了一些初步概念,然后通过一个集成Neo4j和Apache Spark进行预测链接的详细示例。我们说明了如何通过随机森林分类器模型,并结合各种类型的关联特征来改进我们的结果。
本书总结
在本书中,我们介绍了图概念以及处理平台和分析。然后,我们介绍了在Apache Spark和Neo4j中如何使用图算法的许多实际示例,最后我们将介绍图形如何增强机器学习。 图算法是分析现实系统的强大后盾,从防止欺诈、优化呼叫路由到预测流感的传播。我们希望你加入我们,利用当今高度互联的数据,开发自己独特的解决方案。
